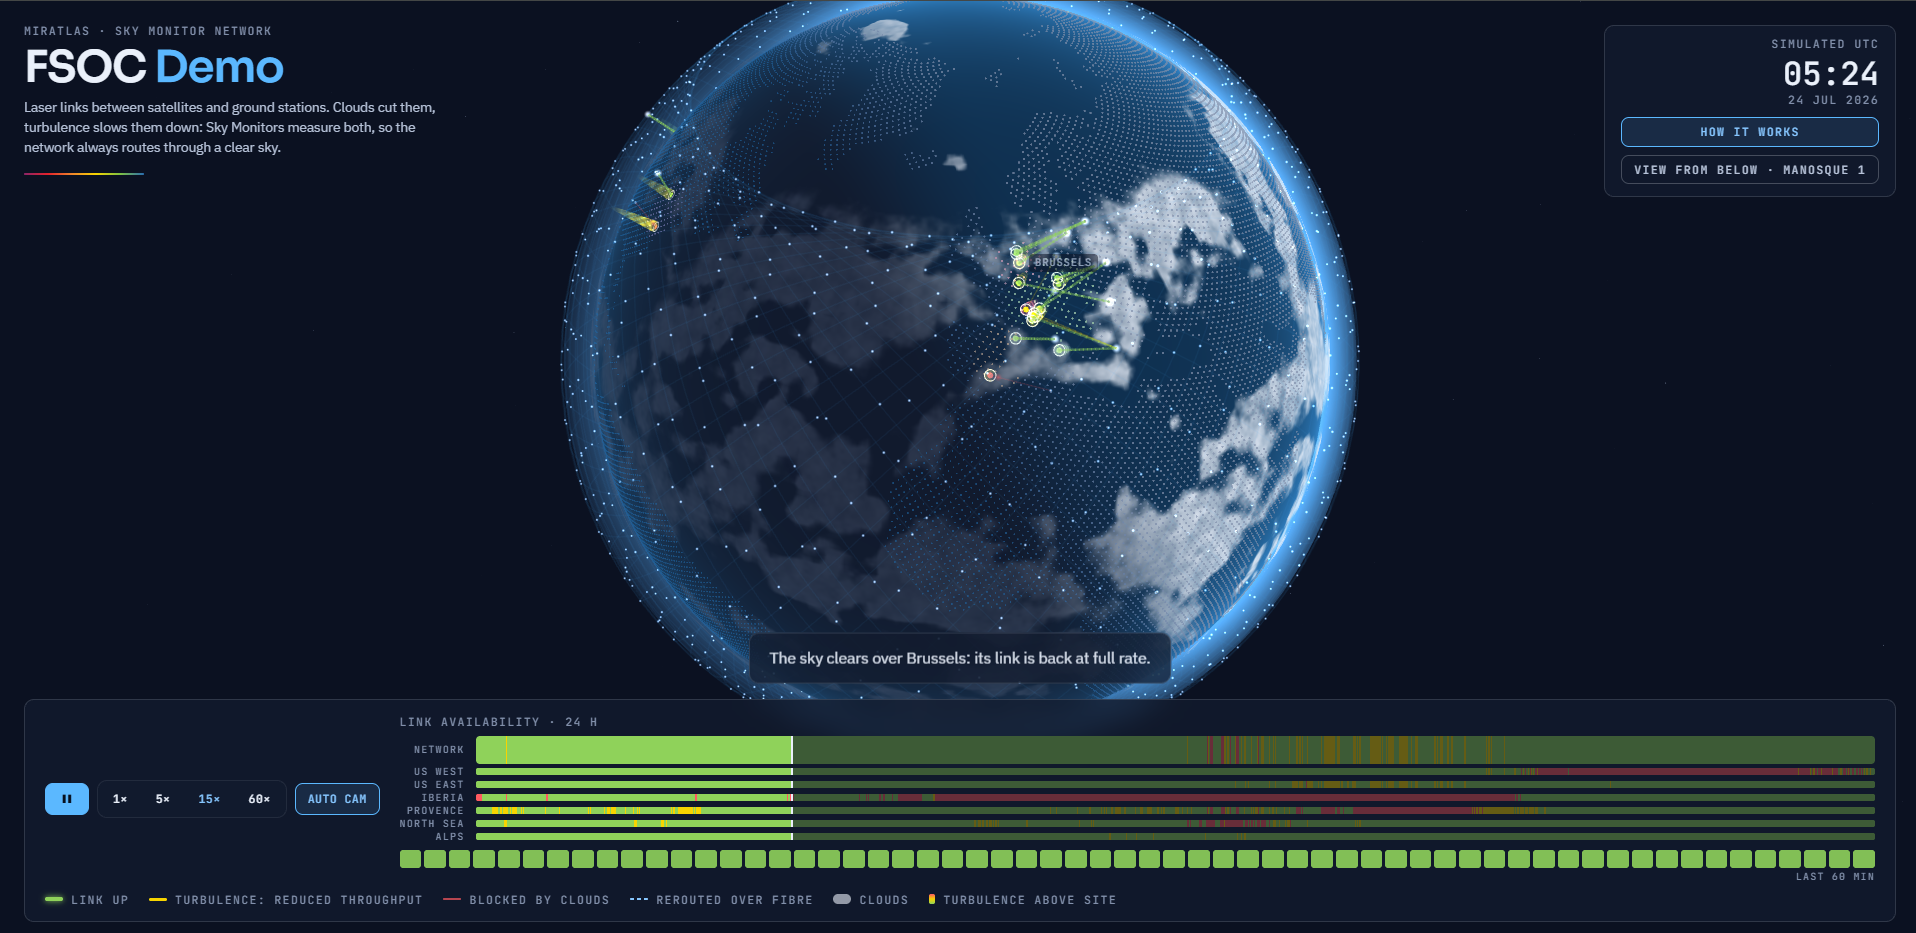
One constellation. Eighteen measuring stations. One real day of weather. Our new demo replays an optical ground network as it works through geometry, clouds and turbulence, using the same rules Miratlas applies to live data.
Demo FSOC is now open to everyone at demo-fsoc.miratlas.com. It is a browser-based visualization that replays a full day of optical ground networking, minute by minute. No account, no install, no sales call: just press play and watch a satellite network discover what the sky is doing above each of its ground stations.
And the day it replays is real. On 24 July 2026, eighteen Miratlas Sky Monitors measured the sky above eighteen sites in Europe and the United States, day and night. At the same time, the EUMETSAT Meteosat cloud mask recorded the weather over Europe, Africa and the Atlantic. The demo places a simulated constellation of 1,584 satellites at 550 km altitude above that day, applies the rules of an optical ground network, and lets the network react.
Three questions, every minute, at every station
Laser links carry far more bandwidth than radio, require no spectrum licence and are very hard to intercept. But light has to cross the atmosphere. So every minute of the day, the demo asks each station three questions. The link is up only when the answer to all three is yes.
1. Geometry: is a satellite in view?
A station can only point at a satellite that is high enough above the horizon. Low in the sky, the beam has to cross too much air. The threshold is 25 degrees of elevation. Like a real station, the demo stays locked on its satellite until it sets, because switching satellites costs acquisition time.
2. Clouds: is the sky clear?
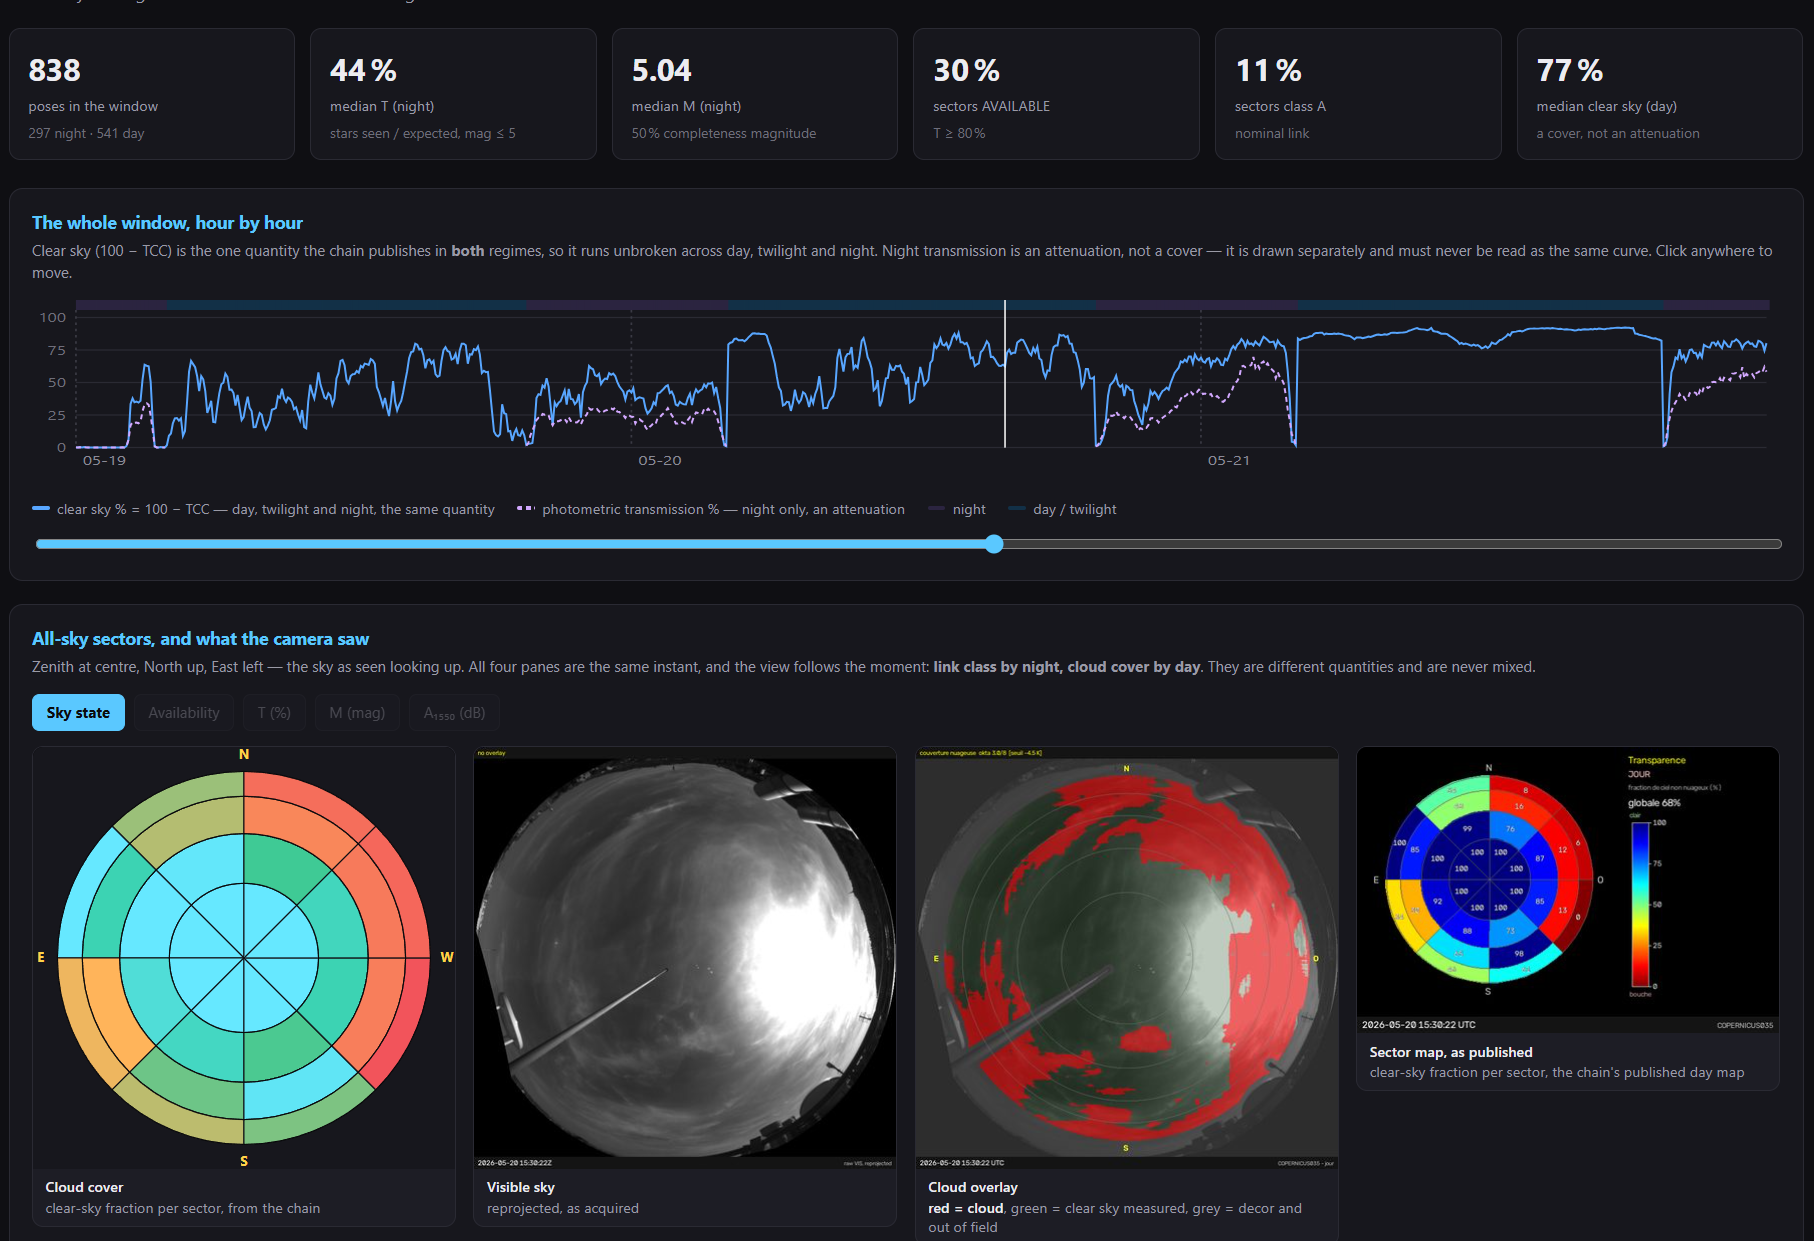
To a laser, a cloud is opaque. When one sits in the line of sight, the link is cut, and no amount of power will get through. The Sky Monitor detects clouds day and night with an upward-looking thermal camera: a clear sky is very cold in the infrared, while a cloud radiates heat back down. The demo uses the same cloud-detection rule as Miratlas' operational tools, calibrated against the Meteosat cloud mask.
3. Turbulence: how much does the air blur the beam?
Under a clear sky the link closes, but not always at full speed. Pockets of warm and cool air act like moving lenses: the beam spreads, less light reaches the receiver, and less data gets through. Physicists measure this effect with the Fried parameter, r₀.
In the demo, a link is usable when r₀ is 5 cm or more. The model assumes a 10 cm effective receiver aperture and a nominal rate of 10 Gbps, and every 3 dB of turbulence loss halves the throughput. This simplified long-exposure model is illustrative by design: a real link budget would also account for adaptive optics, pointing and fibre coupling.
On screen, the answers are easy to read. A link is drawn green and bold when it works, yellow when it closes despite turbulence, and red and faint when the beam stops at the cloud tops.
The answer is the network
One station under a cloud does not matter if another station, elsewhere, has a clear sky. This is called site diversity, and it is what turns the demo into much more than a weather animation.
The arithmetic is simple. Take three sites, each cloudy 30% of the time. If their weather is independent, all three are cloudy at the same moment only 2.7% of the time. The further apart the sites, the closer their weather comes to being independent. And measuring each site is how a network can check that arithmetic before it is built.
On the recorded day, the stations are grouped into six regions: Iberia, Provence, North Sea, Alps, US West and US East. As long as at least one station in a region sees a clear sky, that region carries its own traffic. When clouds cover all of them, the demo reroutes the region's traffic over terrestrial fibre to the nearest region that still has a link. Users stay connected, over a longer path, shown on the globe as a dashed line from the clouded region to the one serving it.
The timeline uses the same colour code at network level: a minute is green when every region is carried by its own sky, yellow when fewer regions are, and red when the network is relying on rerouting.
"Availability figures in this industry are usually promises, drawn from averaged maps of what a region's sky does in a given season," said Jean-Edouard Communal, President and CEO of Miratlas. "We built the demo so the conversation can happen on a real day instead: the 24th of July, measured by eighteen of our stations, replayed minute by minute, with the network discovering the sky as it goes. A network routes to what it knows. The demo exists so anyone can watch what it knows."
Same rules, real data
The demo runs in two modes:
• Scripted day: the weather is generated so that the key moments happen on cue. It is the best way to get a first feel for the mechanics.
• Recorded day: the real 24 July 2026, minute by minute, with each station's own measurements deciding the sky above it. Where a monitor has no measurement for a given minute, the demo fills the gap with its best estimate (a neighbouring station's sky or the station's own trend) and shows it as a dotted line, rather than passing it off as measured data.
The decision rules behind the animation are the same ones Miratlas applies to live Sky Monitor data in its operational tools. Behind them stands the network itself: more than 60 stations in 20 countries measuring cloud cover and optical turbulence around the clock, with a dataset of more than 20 terabytes, available commercially since June 2026 through the DataHub web interface and API.
What the demo replays for one day, the DataHub delivers every day, for any site the network covers.
Try it yourself
Watch the demo: demo-fsoc.miratlas.com
Explore live data from the network, no account needed: data.miratlas.com/demo