
Product · LaserCom Pathfinder

LaserCom Pathfinder.
The right sites, before deploying anything.

For operators planning a network of optical ground stations, the first step is choosing the sites with the best potential for direct-to-Earth laser communication. LaserCom Pathfinder models the atmospheric optical transfer function from historical weather data, advanced turbulence simulation and in-situ validation, so candidate sites are tested before any equipment is installed.

LaserCom Pathfinder
3 hTemporal resolution
0.3°Grid · about 33 km at the equator
137Vertical levels
2018–2023Years modelled so far

01 Site pre-selectionSite analysis & routing · ERA5 · Turbulence modelling

Test a site before you build on it

It is far cheaper to reveal adverse atmospheric conditions on paper than after installing equipment and running operational tests. Pathfinder lets engineers evaluate every candidate site on the globe at once, and keep only the most promising for on-site characterisation.

Open the tool
CostAdverse conditions show up before any equipment is installed or tested on site.
TimeNo extensive commissioning campaign: candidates are compared from historical data.
ScopeAll potential sites worldwide, evaluated simultaneously and ranked.
02 ERA5 data

Built on ECMWF ERA5, the reanalysis of the global climate

The model uses ERA5 from the European Centre for Medium-Range Weather Forecasts, a reanalysis fed by agencies worldwide, NASA and JAXA among them. Three-hour time steps, a 0.3° grid, about 33 km at the equator, surface parameters plus vertical profiles on a 137-level model. The analysis currently spans January 2018 to December 2023, and the database grows over time, for better modelling and global trends.

At surface level
  • Boundary layer height
  • Total cloud cover
  • 10 m wind components (U, V)
  • 2 m temperature
  • Land–sea mask
  • Forecast surface roughness
On the vertical layers
  • Temperature
  • Humidity
  • Wind components (U, V)
  • Geopotential
03 Turbulence parameters

Four numbers that describe what the atmosphere does to a laser beam

From the distribution of turbulence along the altitude, Pathfinder derives the integrated parameters that size an optical link and the mitigation it needs.

r₀ · Fried parameter

The size of the region over which the wavefront stays roughly undistorted: the strength of turbulence integrated over the whole air mass. Larger means calmer. From a few to several dozen centimetres, typically 4 cm at mild low-altitude sites; it grows with wavelength.

θ₀ · Isoplanatic angle

The maximum angle over which the wavefront stays valid across the link: the spatial validity domain of a turbulence state. Usually within 10 arcseconds, inversely proportional to wavelength.

τ₀ · Coherence time

How long the received signal keeps a coherent phase with the transmitted one: the temporal validity domain. A few milliseconds, which sets the maximum response time of the mitigation, adaptive optics, coding.

Cn² · Refractive-index structure constant

The distribution of turbulence strength along the altitude, born of temperature, pressure and humidity fluctuations. A typical profile peaks at the tropopause, with strong turbulence in the ground layer.
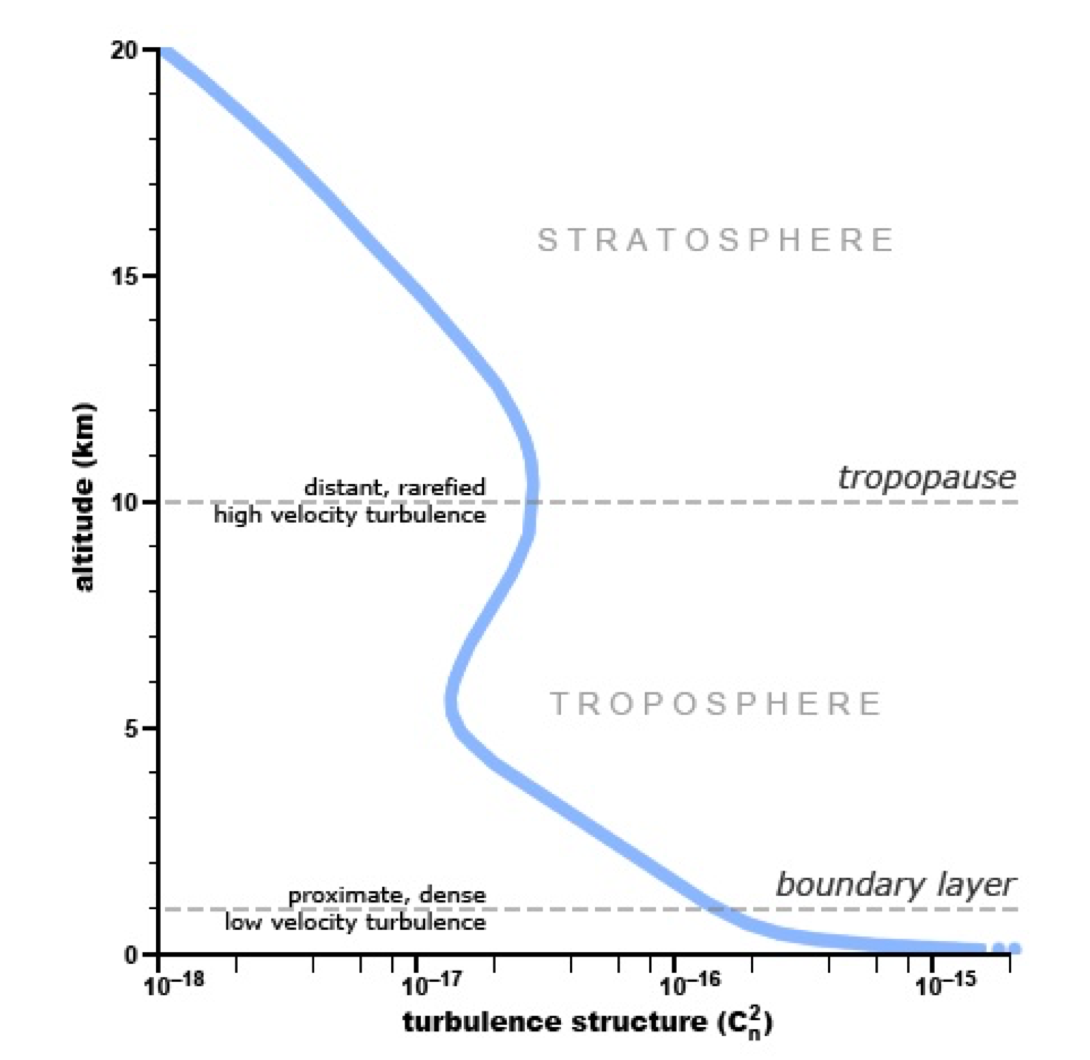
A typical Cn² profile: peak at the tropopause, strong turbulence in the ground layer Enlarge
Fig. 01A typical Cn² profile: peak at the tropopause, strong turbulence in the ground layer
04 Turbulence modelling

From global weather data to a turbulence profile at every point

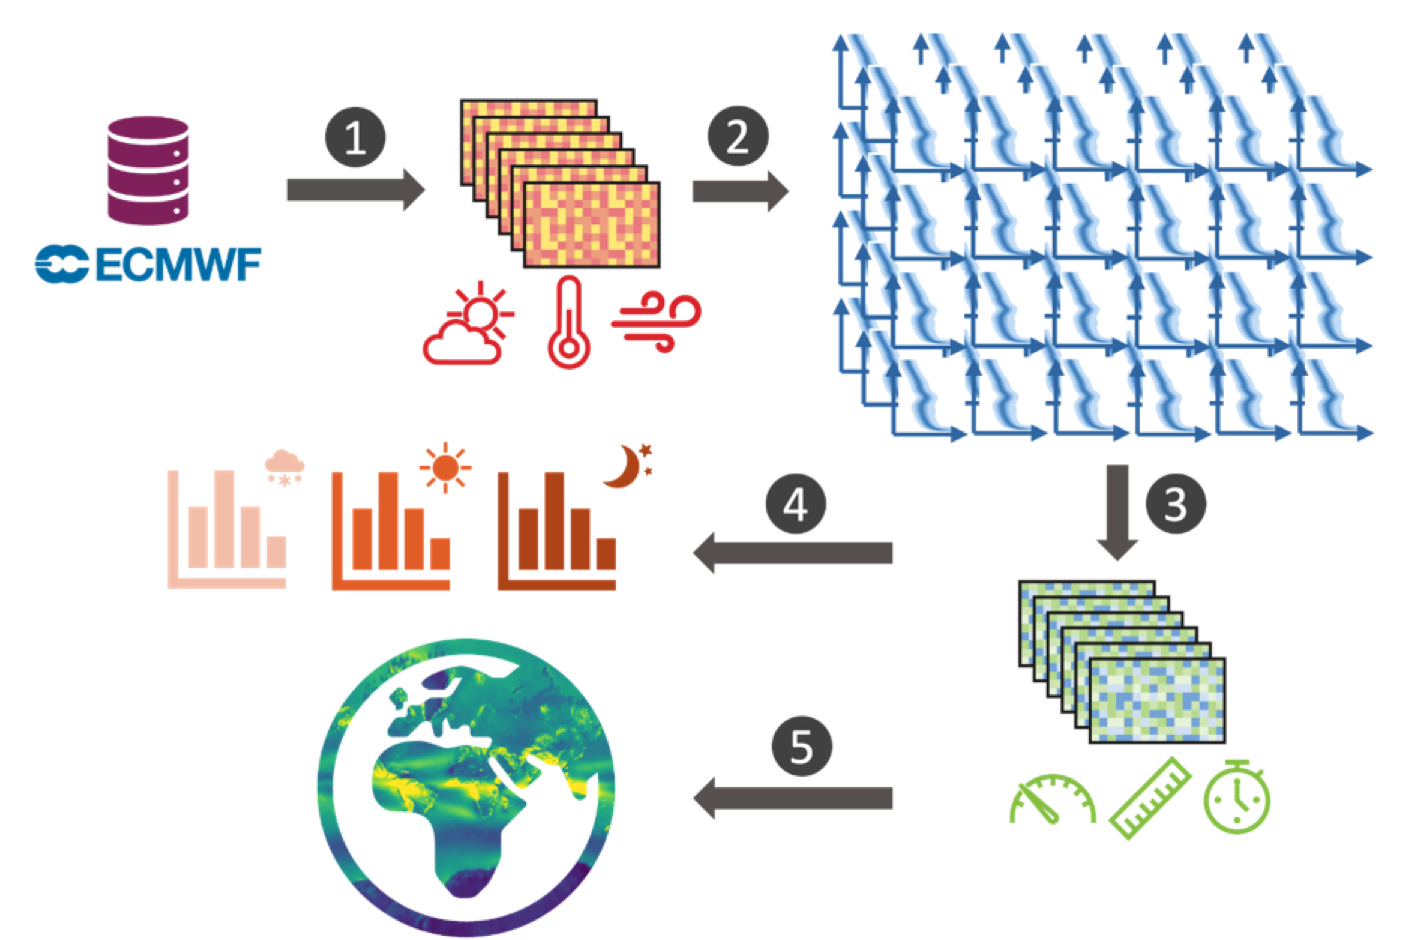
With Durham University, Miratlas developed a modelling algorithm that characterises turbulence from atmospheric parameters: for every cell of the grid and every time step, a local Cn² profile is computed, and the integrated parameters follow.

1
DownloadERA5 GRIB files through the CDS API: the whole globe, at every time step.
2
Cn² profileEstimated for every cell over the 137 levels, or adjusted to the altitude of the sites you provide.
3
Integrated parametersr₀, θ₀ and τ₀ derived from each profile.
4
StatisticsBy day and night, season and year, for every site.
5
MapsGlobal maps of any parameter.
From the ECMWF source to the statistics and maps Enlarge
Fig. 02From the ECMWF source to the statistics and maps

Reference Osborn, Communal & Jabet (2023), Global atmospheric turbulence forecasting for free-space optical communications, SPIE · doi:10.1117/12.2649795

05 What you get

Local characterisation, global maps, site combinations

Local site characterisation

Statistics on the turbulence parameters over the years reveal the character of a site: strong or weak turbulence, better by day or by night, in winter or in summer. Averages per hour and per season expose the patterns: here r₀ dips around midday, more so in summer than in winter.
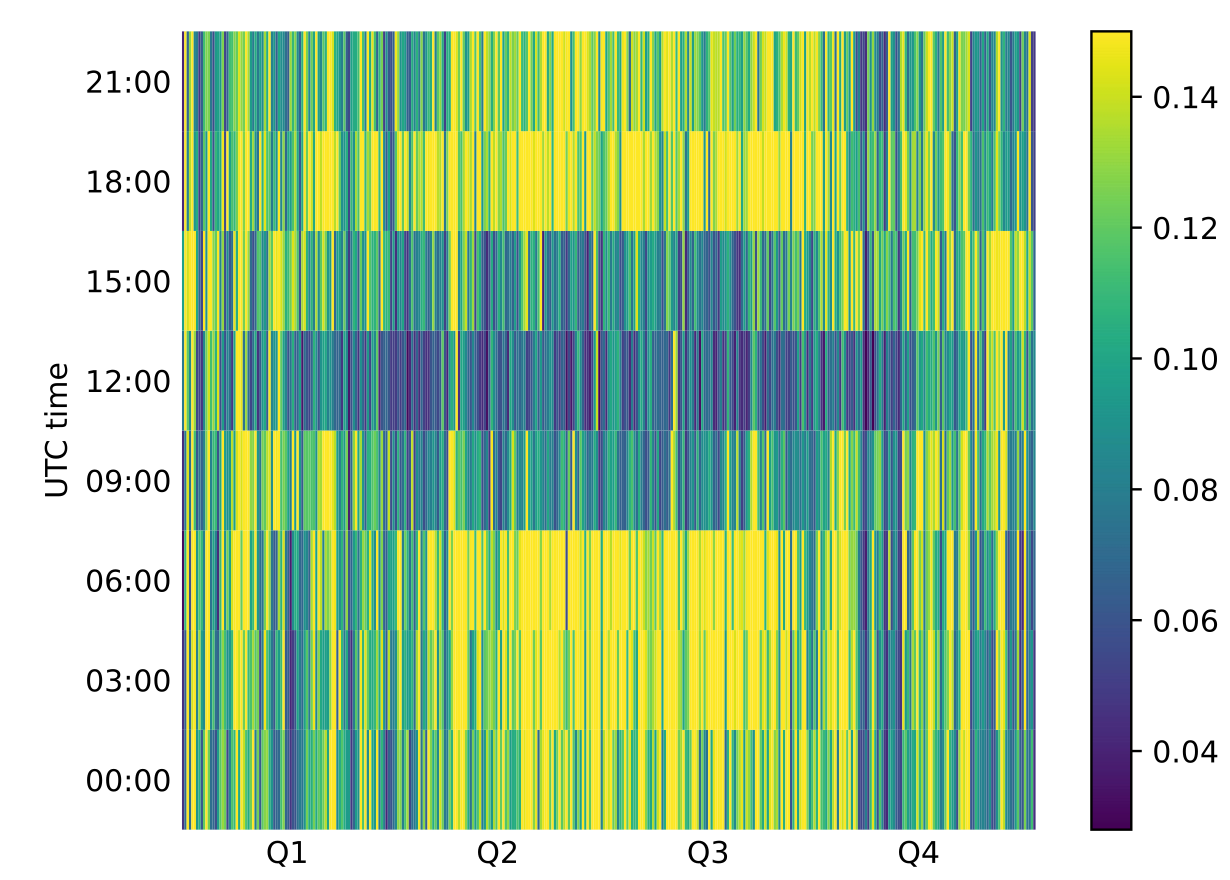
Temporal averages of r₀ for a site in Western Europe Enlarge
Fig. 03Temporal averages of r₀ for a site in Western Europe
Global maps

Any parameter can be mapped over the whole world to reveal global patterns: here the daytime cloud cover during the northern-hemisphere summer.
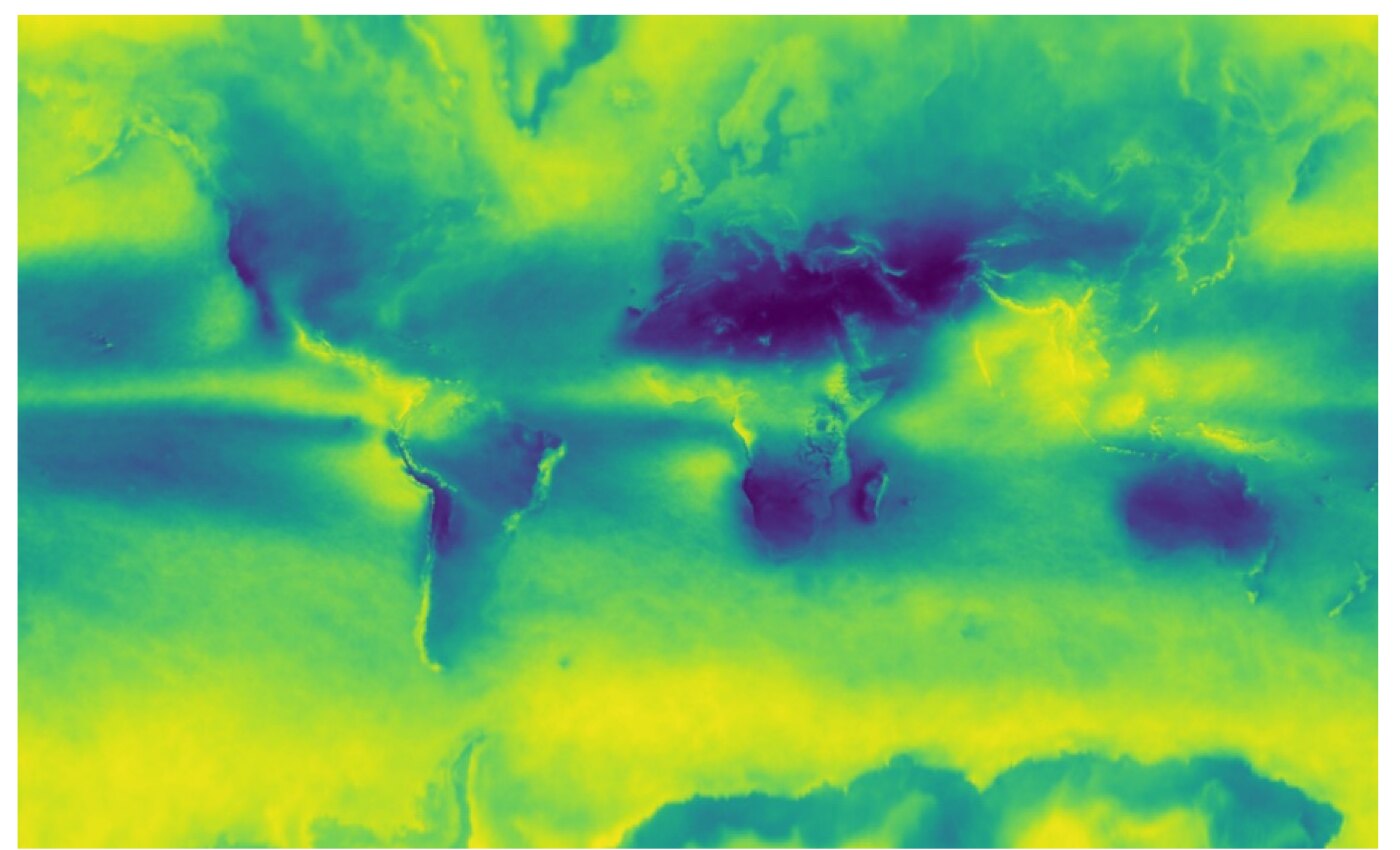
Percentage of daytime cloud cover over the third quarter of the year (cropped) Enlarge
Fig. 04Percentage of daytime cloud cover over the third quarter of the year (cropped)
Site combination

Combining turbulence and cloud cover dismisses the worst locations. Then, from the decorrelation of their weather, Pathfinder proposes the best and smallest subset of sites that reaches a target network availability, 99.9 %, for instance.
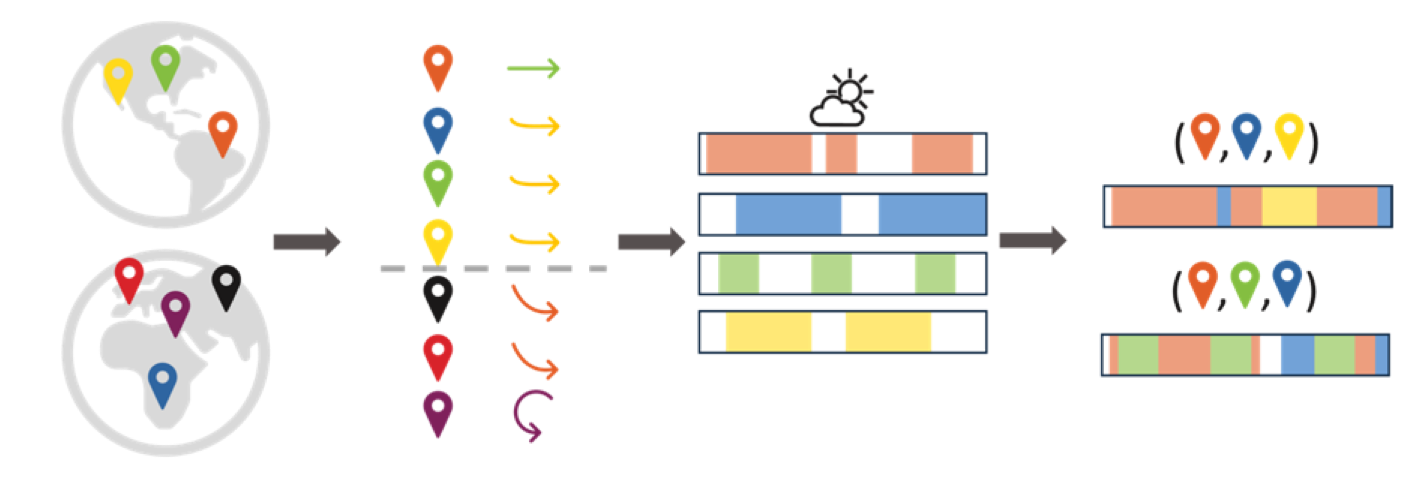
From local metrics to the best combination of sites Enlarge
Fig. 05From local metrics to the best combination of sites
06 Site validation

The model shortlists, the Sky Monitor confirms

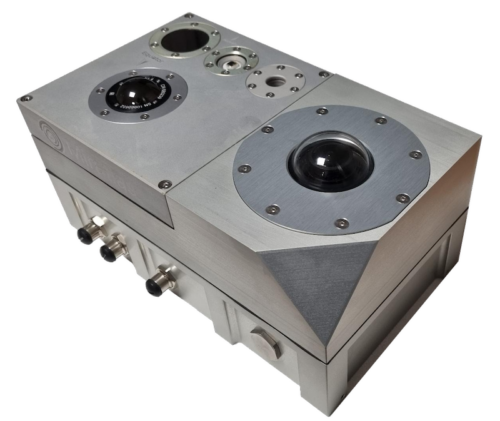
Modelling is limited in temporal and spatial resolution; daytime turbulence is a very local phenomenon where a few metres can change everything; and pollution, aerosols and dust cannot be modelled at all. Pathfinder should therefore be followed by in-situ analysis with a Sky Monitor installed as close as possible to the future station, through the seasons. Only in-situ measurement confirms the availability and capacity of a location.

Start with the right sites.

Order a site analysis online, or talk to us about the network you are planning.

Site analysis pricing Book a demo