One dashboard for your whole organisation
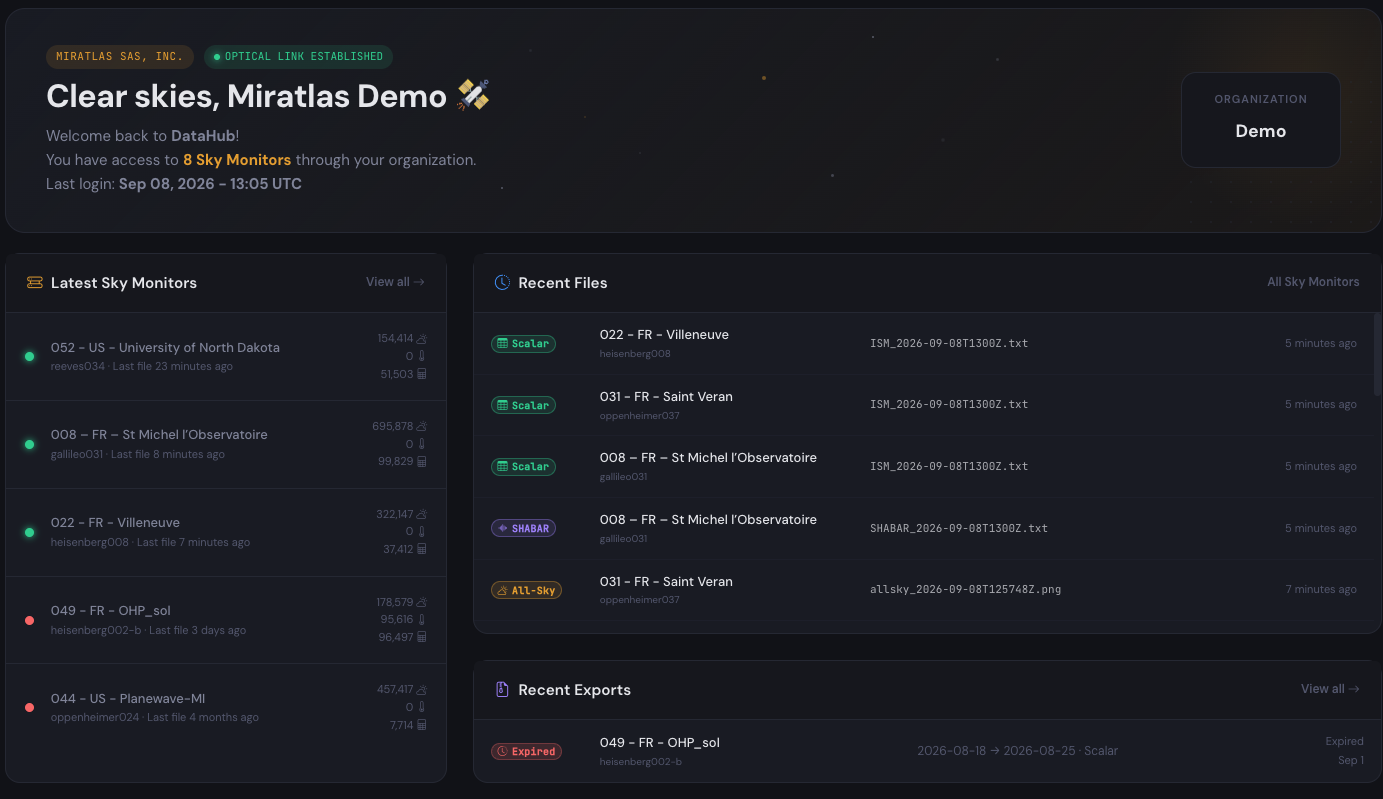
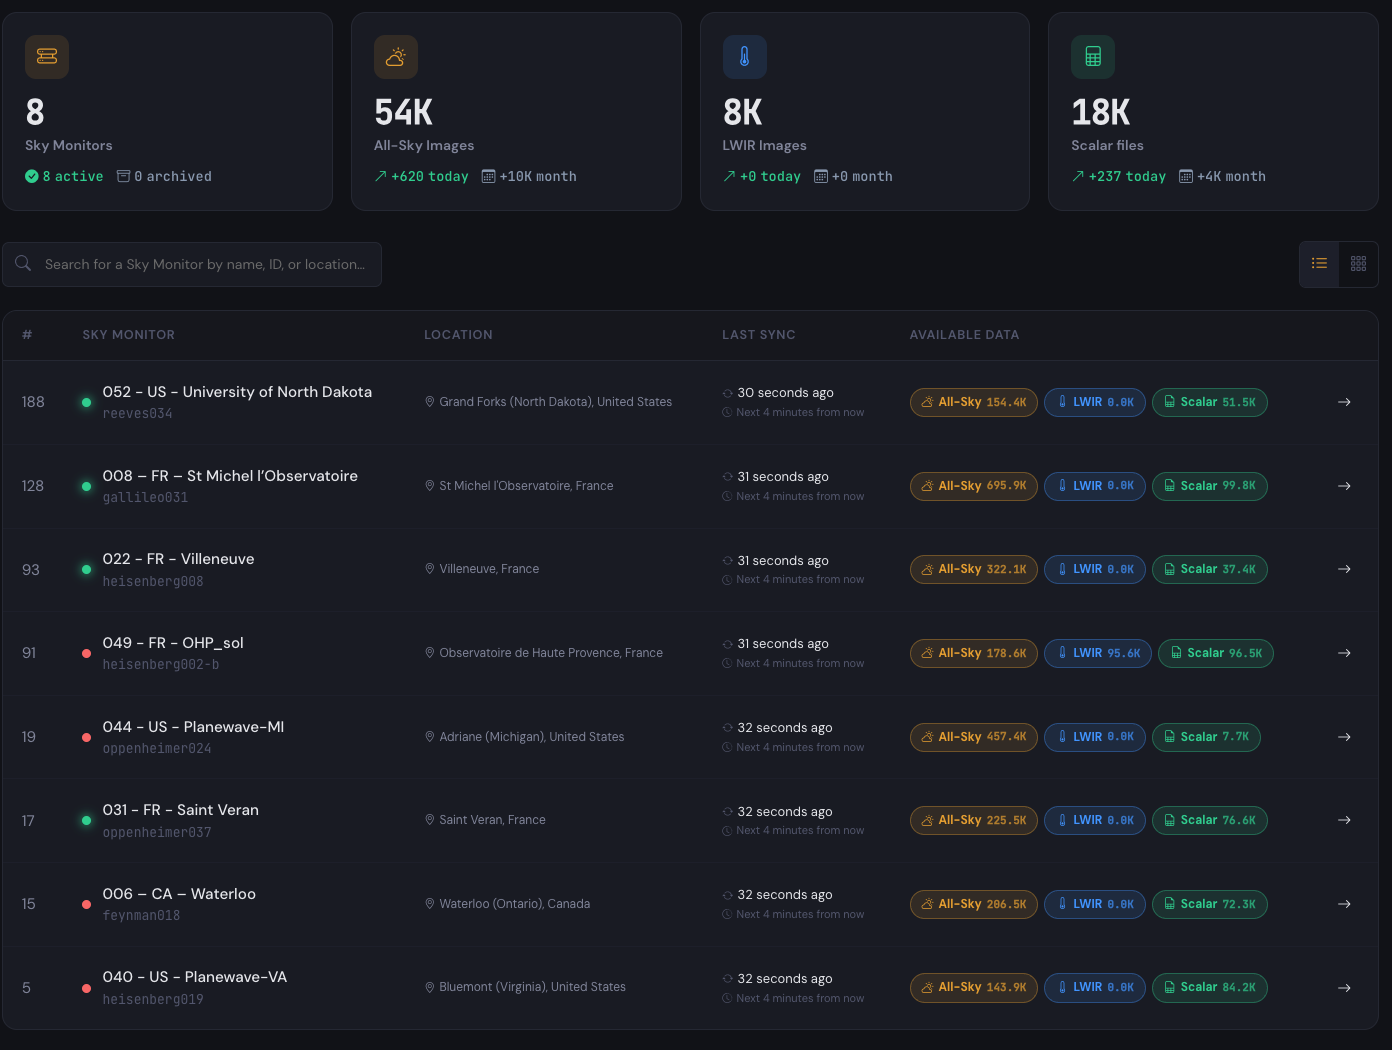
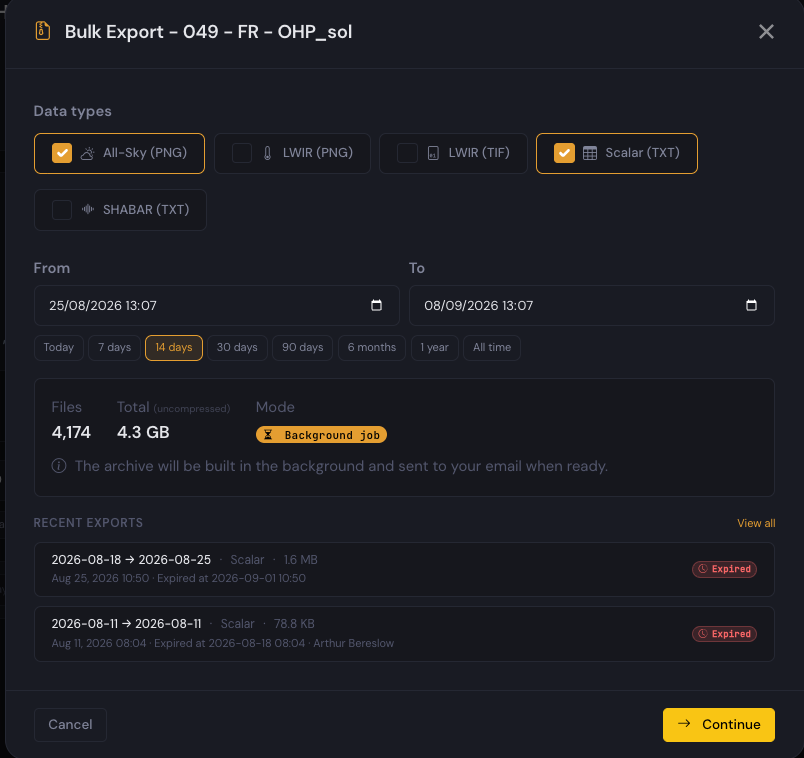
The home page sums up what matters: the Sky Monitors you have access to, with their status and last file; the files that just arrived from any of them; and your recent exports with their expiry.
Browse the sky, image by image
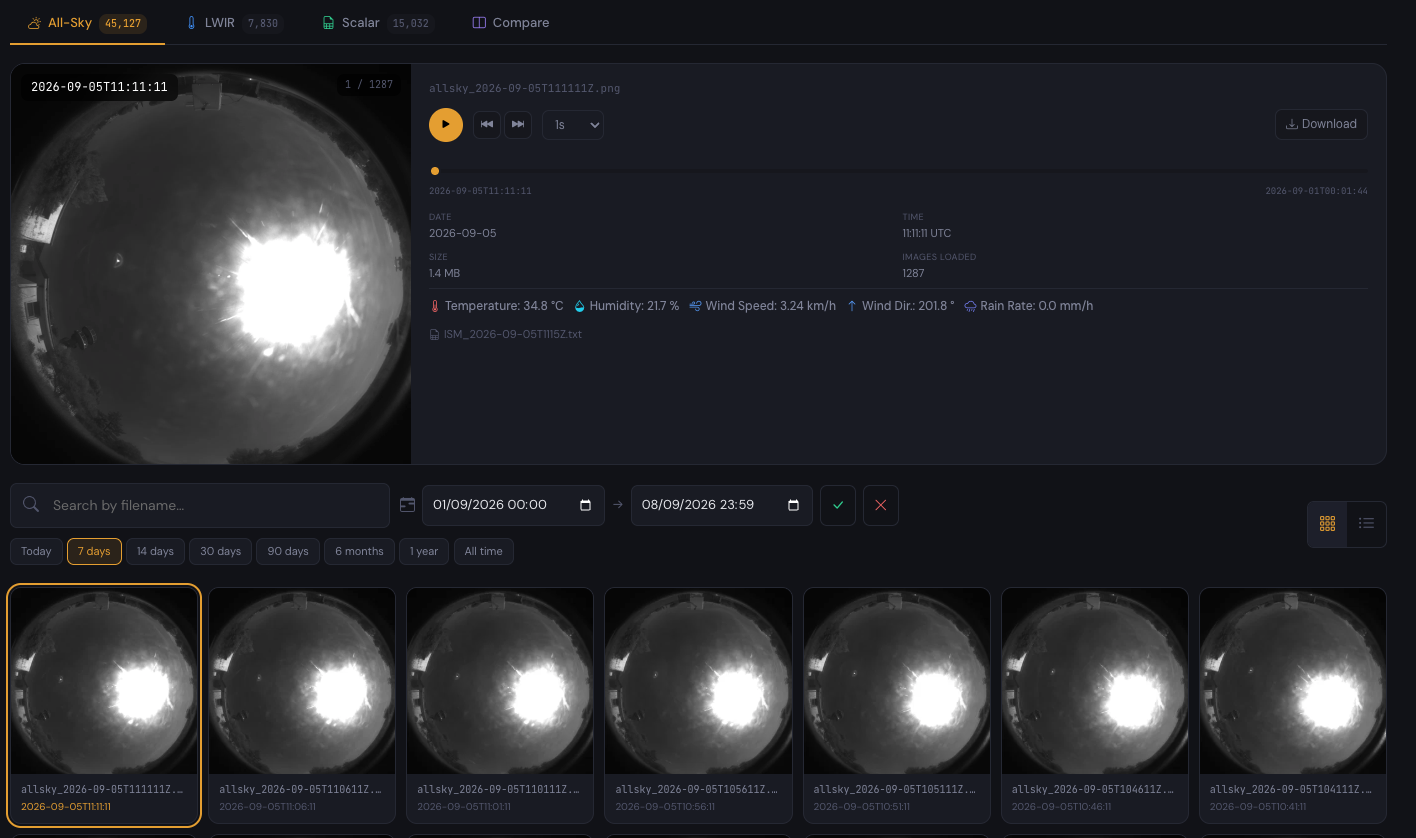
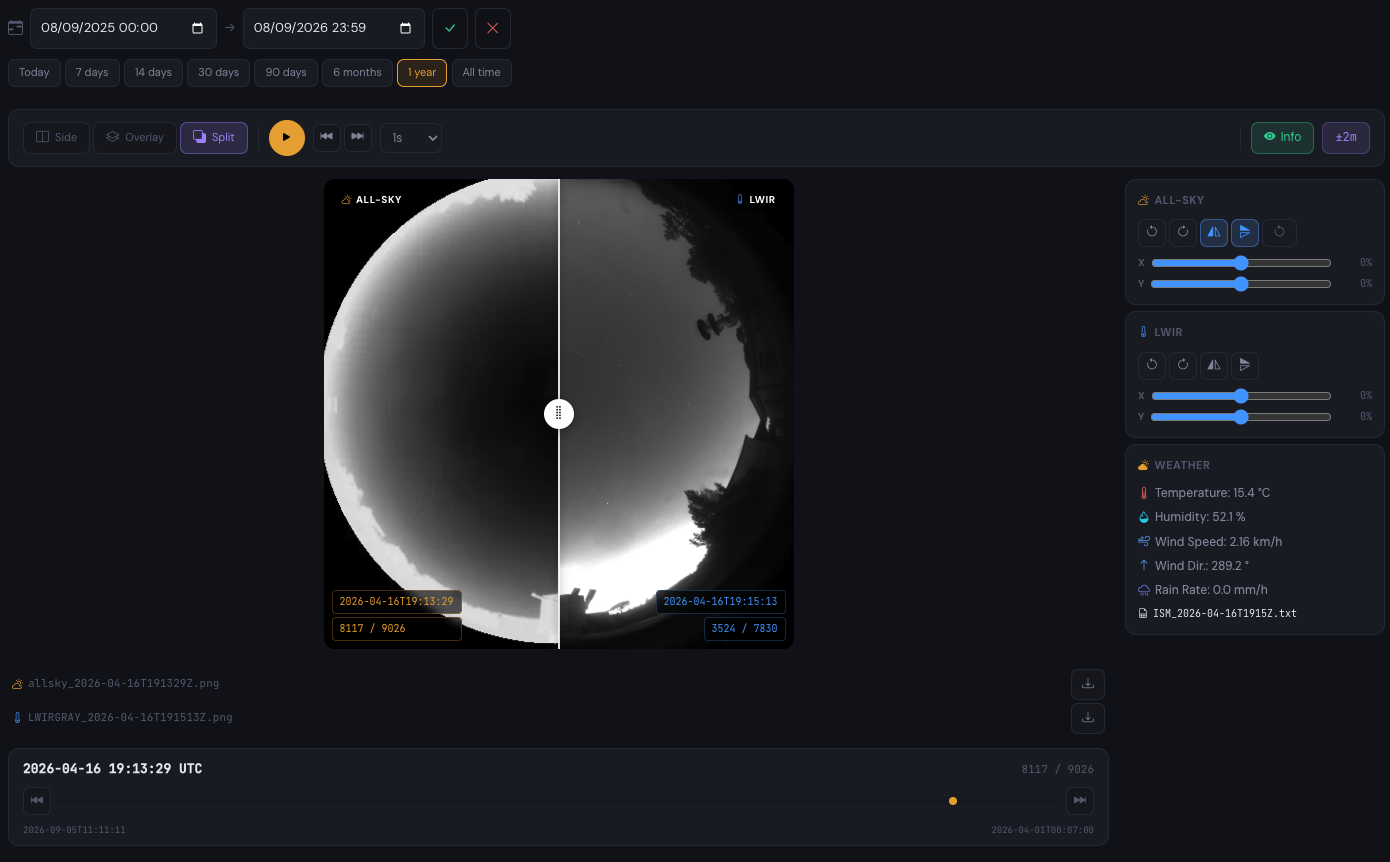
Every Sky Monitor page lists its all-sky images by date. Filter a period, play the sequence like a time-lapse, and read the weather at the moment of capture: temperature, humidity, wind, rain, next to each frame.
Visible and thermal, side by side
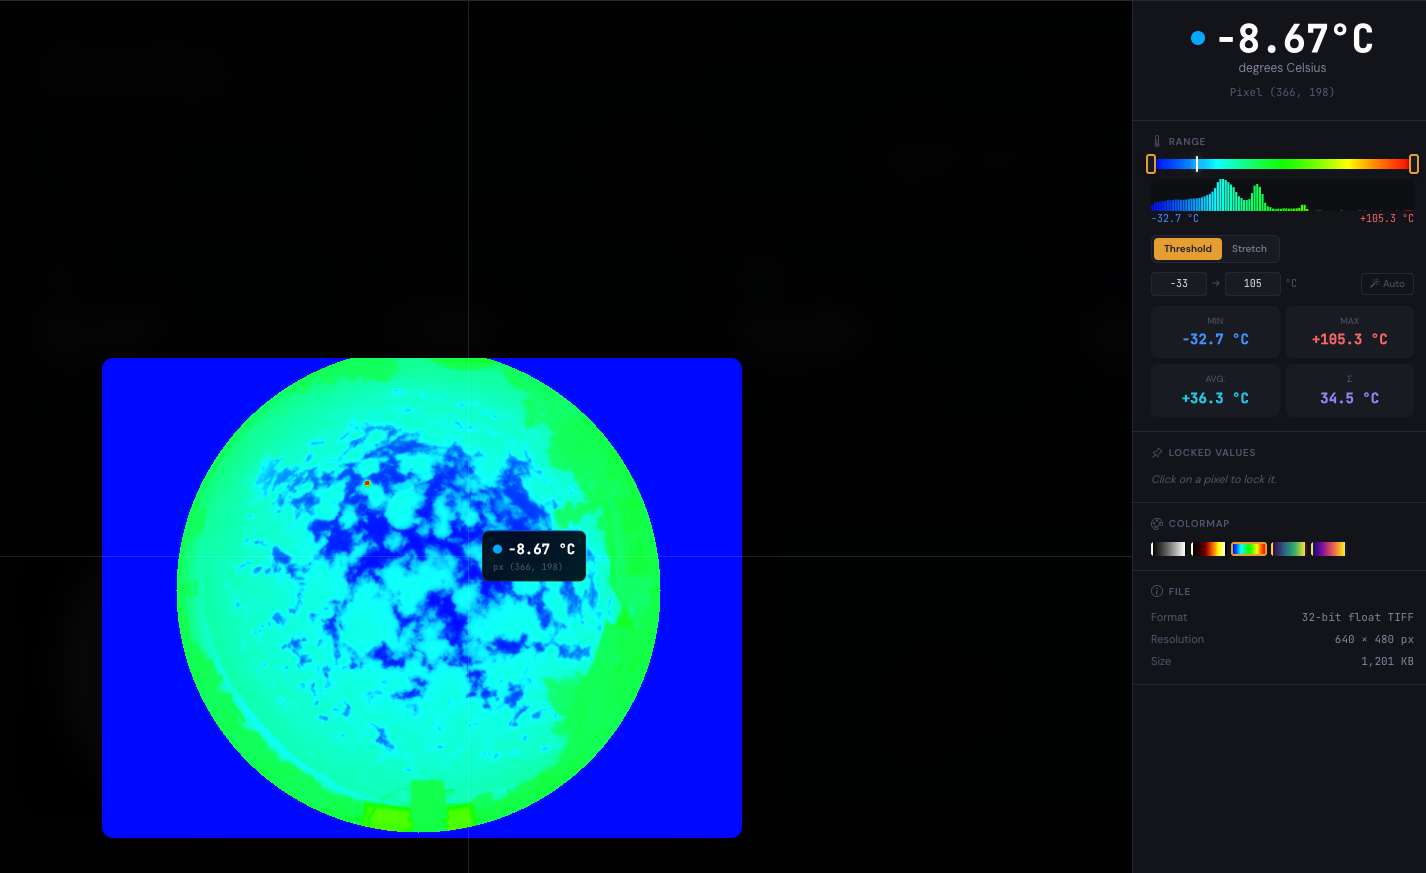
Match an all-sky image with the LWIR image taken at the same moment, within a tolerance you choose, and compare them side by side, overlaid or with a split slider, with the weather at that instant.
Every file the network produces, one request away
DataHub exposes the same data as the web interface through a REST API, authenticated by a token per organisation: images, records and metadata for each Sky Monitor. Every endpoint is documented in DataHub: request, parameters and response, and the documentation generates the calling code in the language of your choice.
GET /api/v3/sky-monitor/{id}/allsky
PNG, by period.
GET /api/v3/sky-monitor/{id}/lwir
PNG for viewing, 32-bit TIFF for analysis.
GET /api/v3/sky-monitor/{id}/scalar
ISM.txt weather and turbulence records, SHABAR.txt profiles.
POST /api/v3/sky-monitor/{id}/flux
Run a Flux query against the Sky Monitor’s own InfluxDB instance.
Standard is included with every Sky Monitor
Advanced and Premium add the analysis tools, reporting and support on top; prices are in the configurator, with the data plans.