Product · Sky Monitor

Complete, cutting-edge atmospheric characterisation in a telecom-grade system

Born from decades of astronomical research, the Sky Monitor is the first system to include the full range of instruments needed to characterise optical atmospheric transmission, in a compact, rugged, easily installed package.

Loading the 3D model…
3DV4
Fig. 01 · Sky Monitor

01A breakthrough in atmospheric scienceAtmospheric qualifier · Since 2018

An unprecedented level of integration and performance: the only solution on the market for live, high-resolution characterisation of cloud cover and turbulence by day and night, designed to be networked and provide data on a global scale.

Continuous, real-time measures

Atmospheric conditions measured 24/7/365, streamed to DataHub as they happen.

Cost reduction ×5 to ×10

Almost ten times less expensive than equivalent instruments, and maintenance-free.

Compact and easy to deploy

27 × 17 cm, 5 kg: one person installs it in a few hours.

Data accessibility

A user-friendly online database, Grafana dashboards and a REST API.

02 Product

Continuous, high-resolution, real-time measurement of all atmospheric parameters

Survey optical ground station sites

An all-in-one system measuring cloud cover, atmospheric turbulence and absorption to survey candidate sites. Deployed as a network, it enables site comparison and selection for the optimal ground network design and future operations.

Explore the network map

Ensure optimal operations

Sky Monitor data keeps each ground station at its best: selecting the best path through the atmosphere from live and forecast channel conditions to ensure continuity, maximise bandwidth and minimise handover costs.

LaserCom Pathfinder
03 CCSDS

The first and only system including all the instruments recommended by the CCSDS

For Free Space Optical Communications, the Sky Monitor delivers high-resolution visible and thermal images of the whole sky, turbulence by night and by day, water-vapour absorption, irradiance and weather data.

All-sky visible imager450–1000 nm · cloud cover, transparency
All-sky thermal imager8–14 µm LWIR · day & night clouds
C-DIMMNight-time turbulence, r0 & seeing
Sun Scintillation SensorDaytime turbulence, r0 & seeing
SHABARCn² profile up to 1 000 m (option)
Weather stationWind, T°, humidity, pressure, rain
04 In the field

Installed on every kind of site

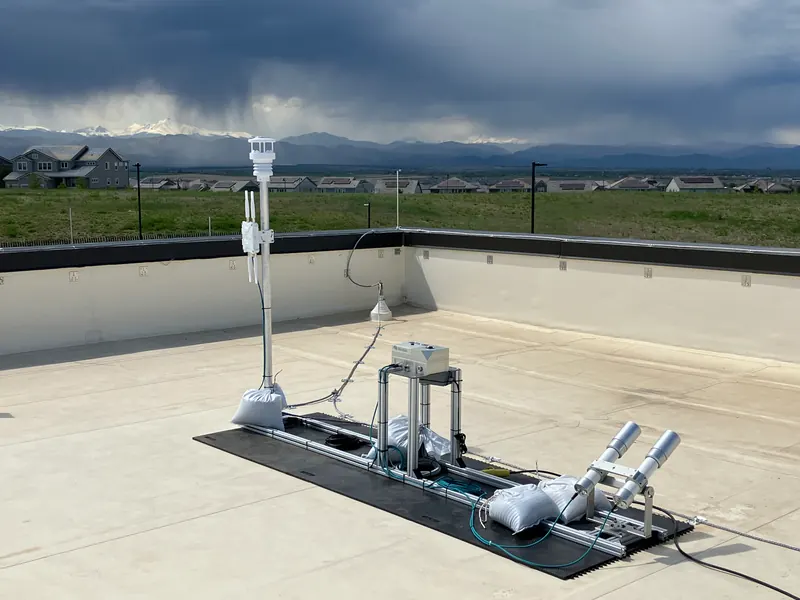
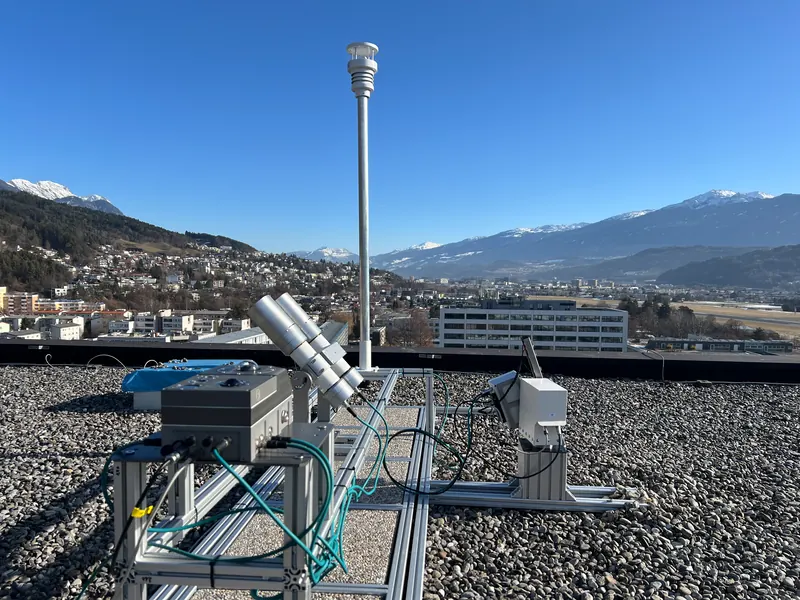
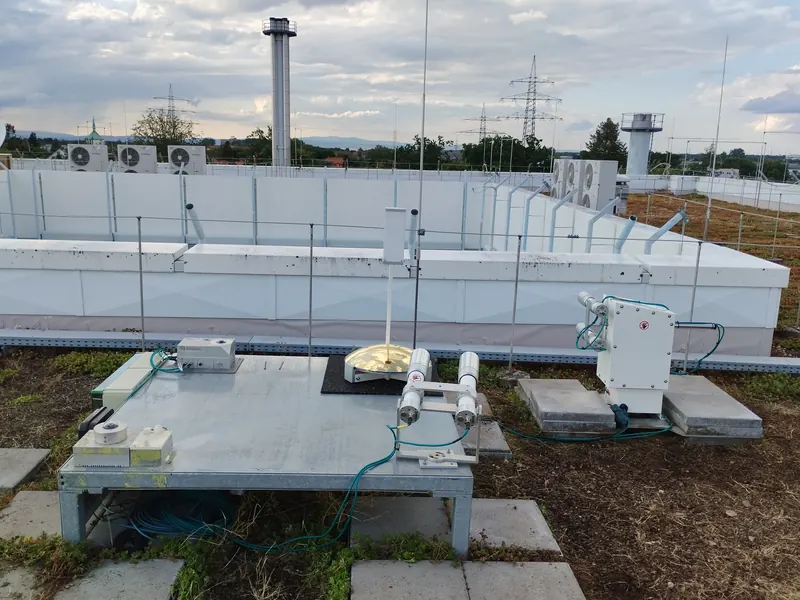
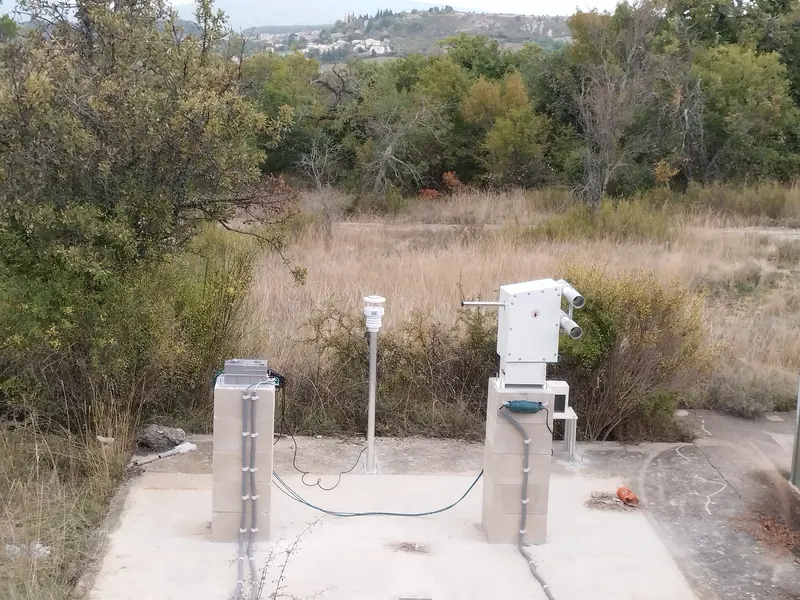
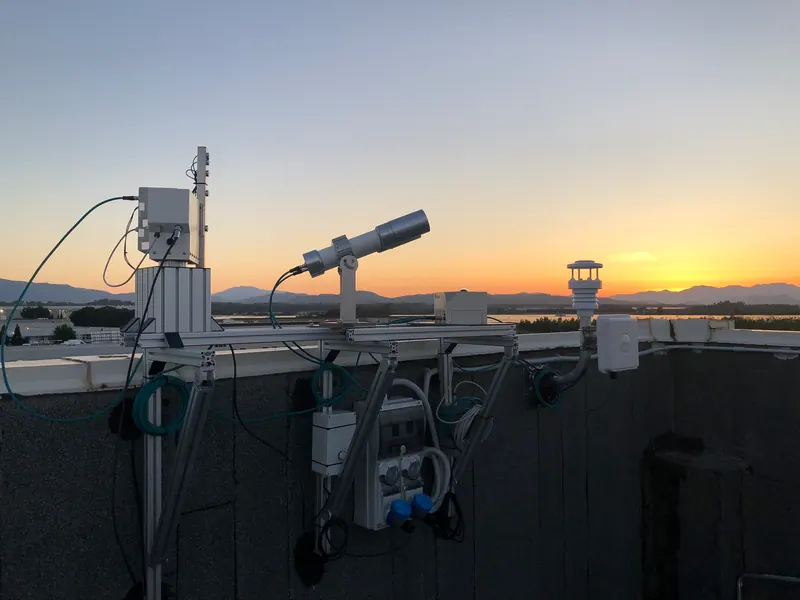
On gravel under an Abu Dhabi sky, on pillars in Haute-Provence, on a ballasted frame on a Colorado roof: the same compact instrument, installed by one person in a few hours.
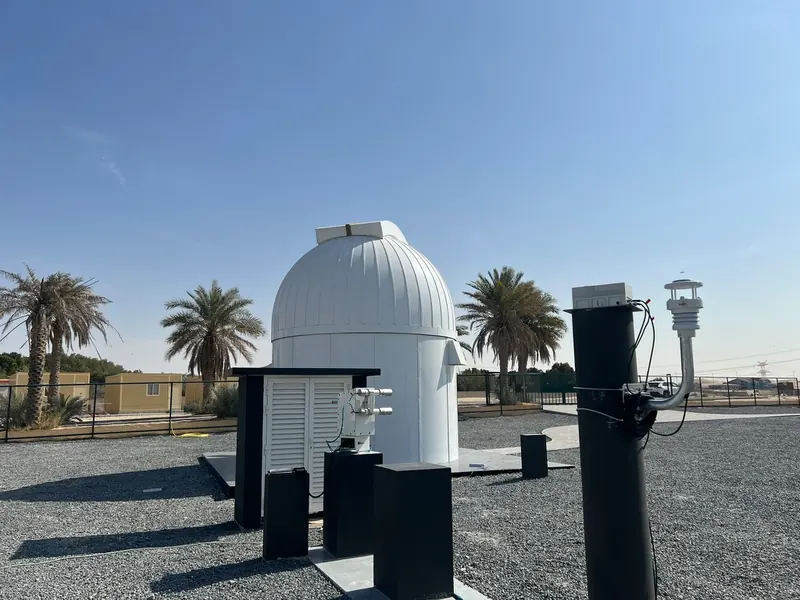
Sky Monitor · Abu Dhabi · AE
Abu Dhabi · AE
Sky Monitor · Cagliari · IT
Cagliari · IT
Sky Monitor · Colorado · US
Colorado · US
Sky Monitor · Innsbruck · AT
Innsbruck · AT
Sky Monitor · Darmstadt · DE
Darmstadt · DE
Sky Monitor · Haute-Provence · FR
Haute-Provence · FR
05 SleipnirRuns on every Sky Monitor
Sleipnir

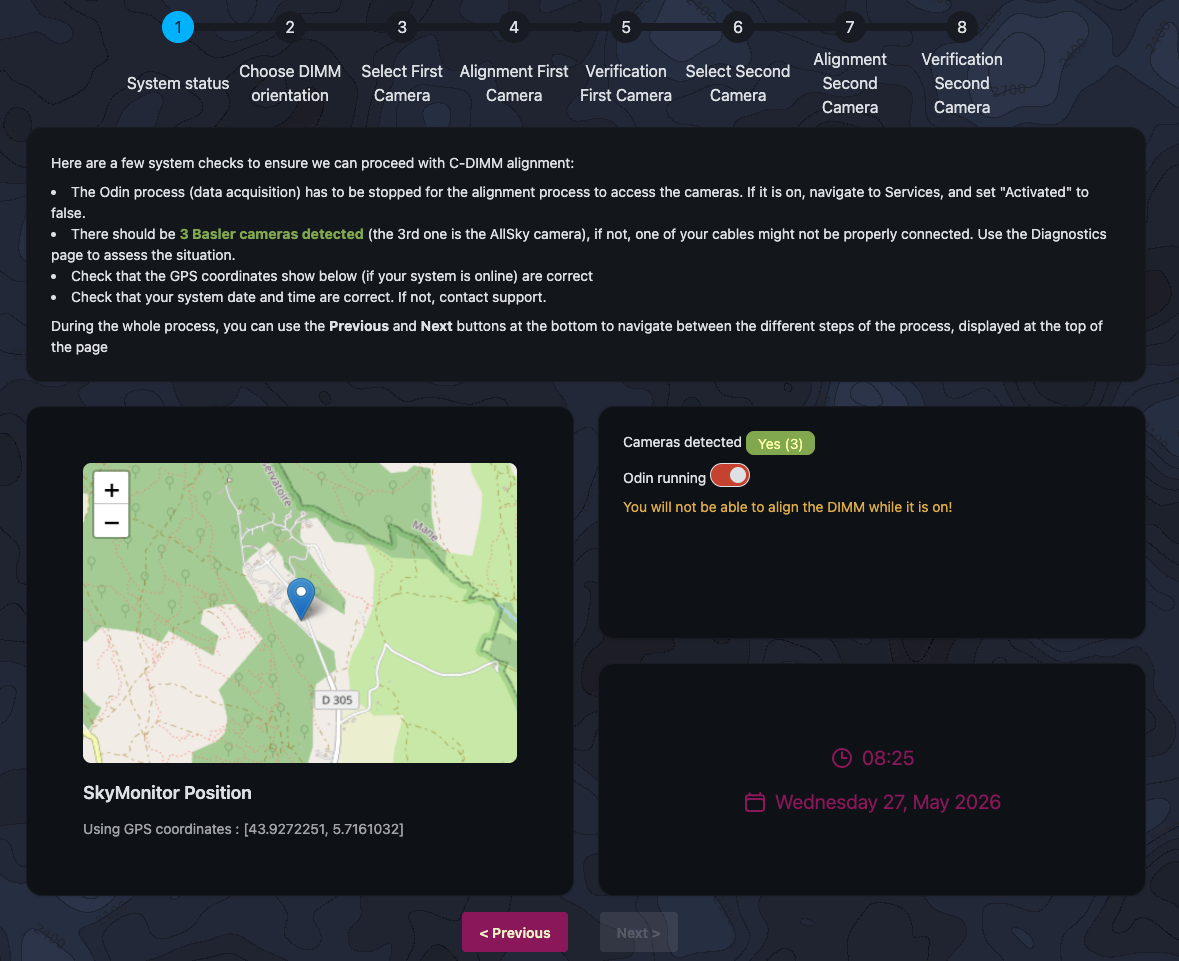
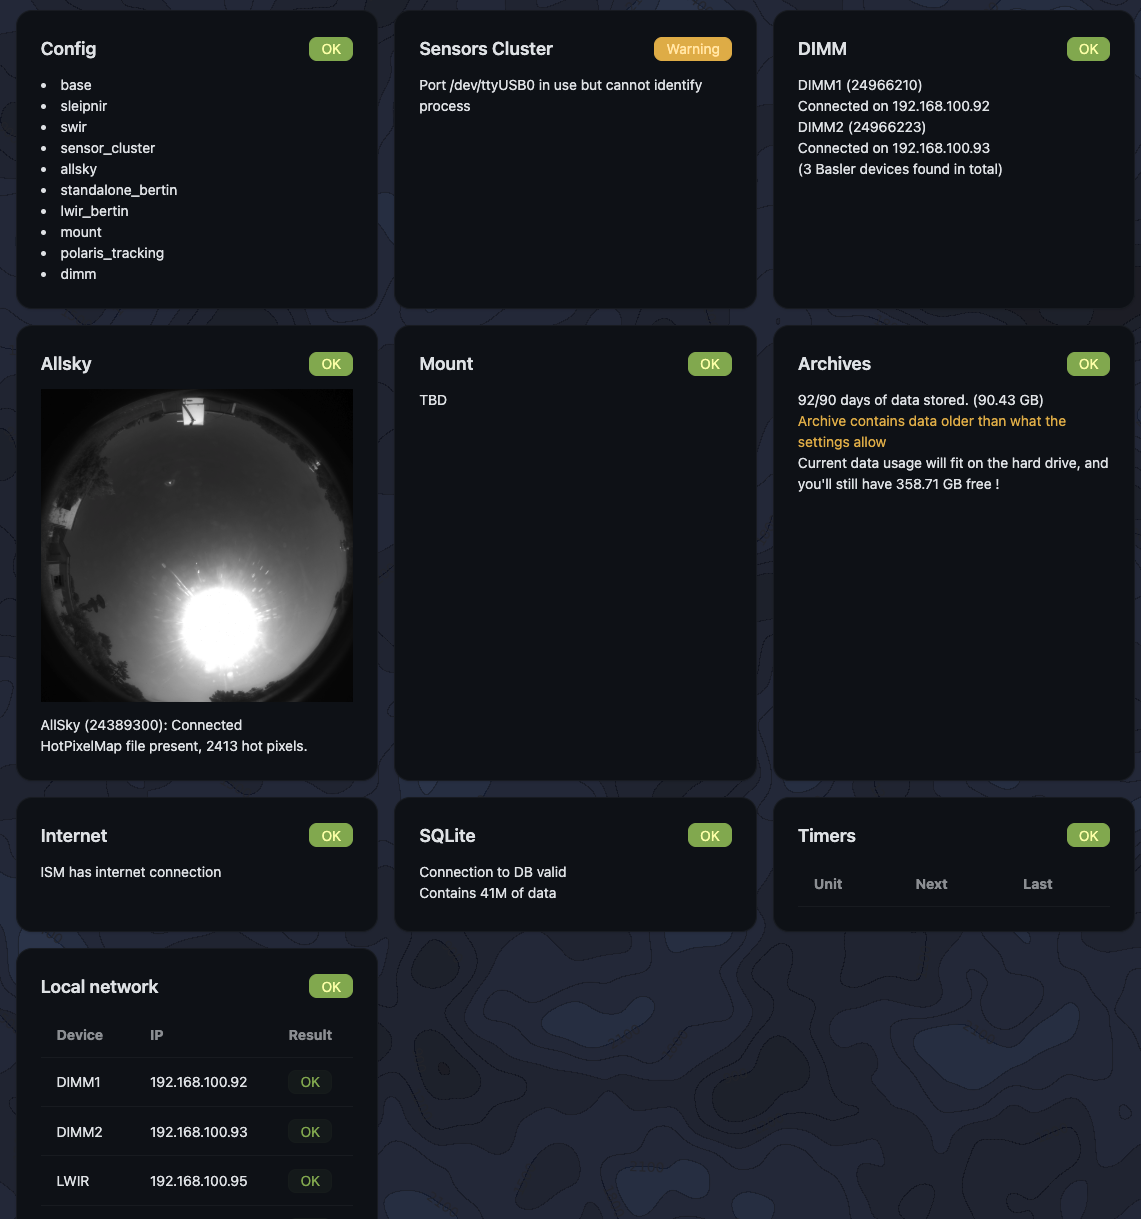
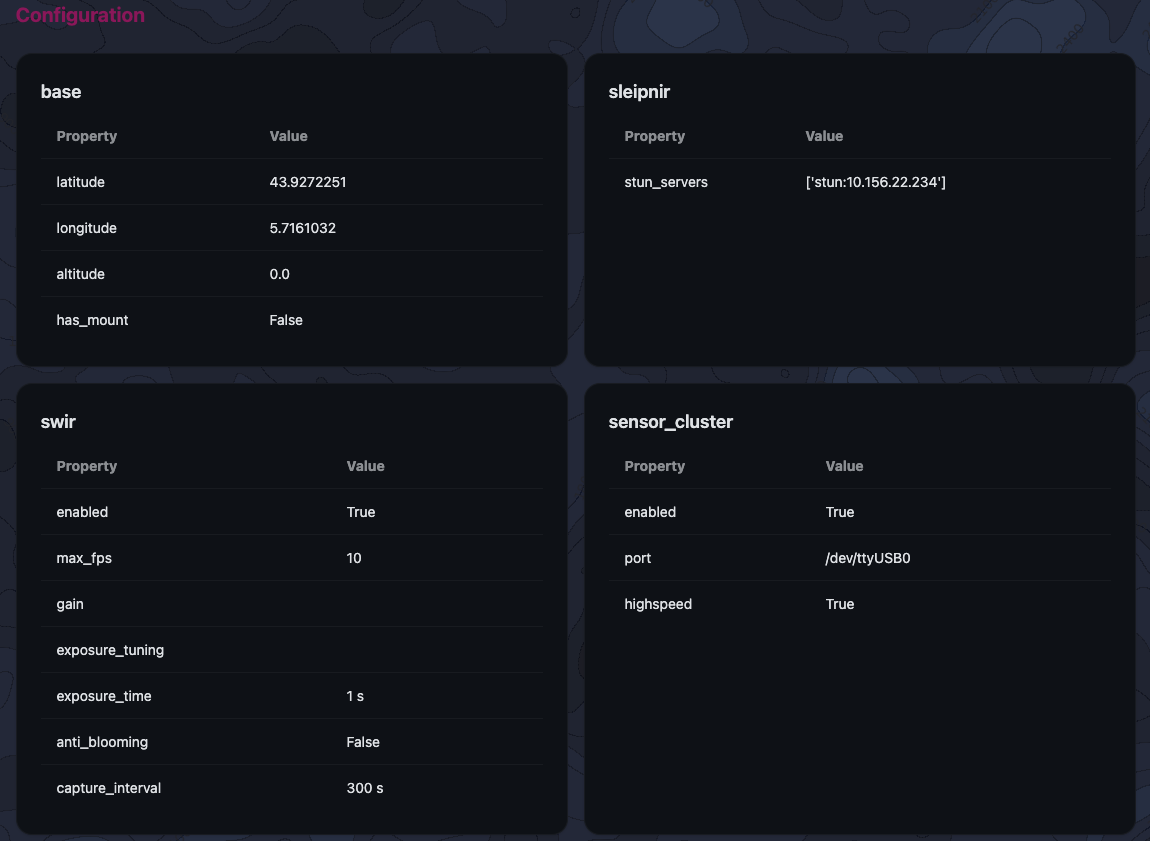
Sleipnir: the onboard web interface for management and diagnostics

Every Sky Monitor ships with Sleipnir, a web application running on the instrument itself. Open it from any browser on the local network to control, configure and monitor the whole system, no software to install.

  • Alignment & controlDIMM alignment, mount control, camera settings and exposure schedules.
  • Network & configurationNetwork setup, time sync, services and firmware updates.
  • Logs & diagnosticsLive sensor health, log access, self-tests and measurement results.
Enlarge Sleipnir · C-DIMM alignment Sleipnir · Diagnostics Sleipnir · Configuration
Fig. 02 · Sleipnir · C-DIMM alignmentOnboard · local network
06 Data access

Three ways to retrieve Sky Monitor data

Sky Monitor data is yours to pull the way your workflow needs it: straight from the instrument on your own network, or from the Miratlas cloud, where every site of the network comes together.

Local

On your network, from the instrument itself

Directly from the instrument, on your network
SkyAPIREST
REST API served by the Sky Monitor: measurements, images and status, machine-readable.GET /api/v1/measurements
rsyncMirror the raw archive to your own storage over SSH, scriptable, incremental.rsync -avz sm:/data ./
FilebrowserOpen-source, self-hosted web file manager running on the Sky Monitor: browse, preview and download the data from any browser.
Cloud

Centralised, for every site of the network

Centralised, multi-site
DataHubREST Bulk export ZIP

Your data, and the whole network’s, in the Miratlas platform: web interface, Grafana dashboards, REST API and bulk ZIP export of any period.

DataHub in detail
Grafana dashboards

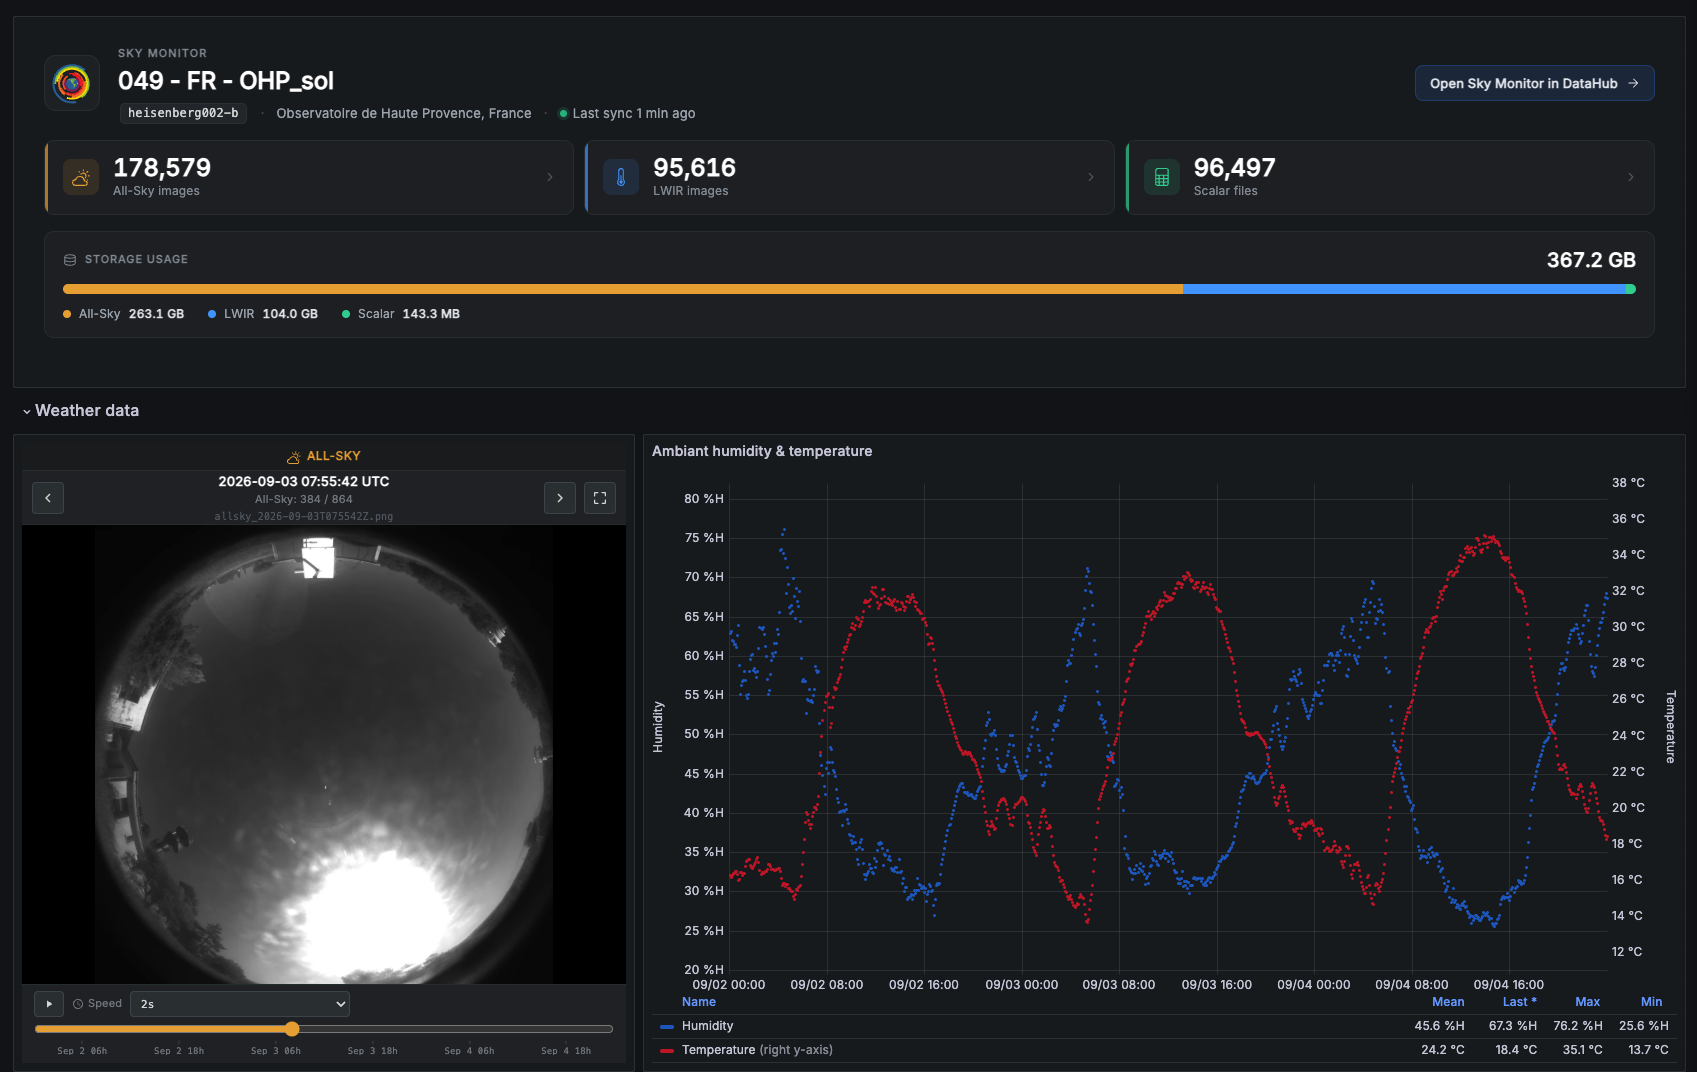
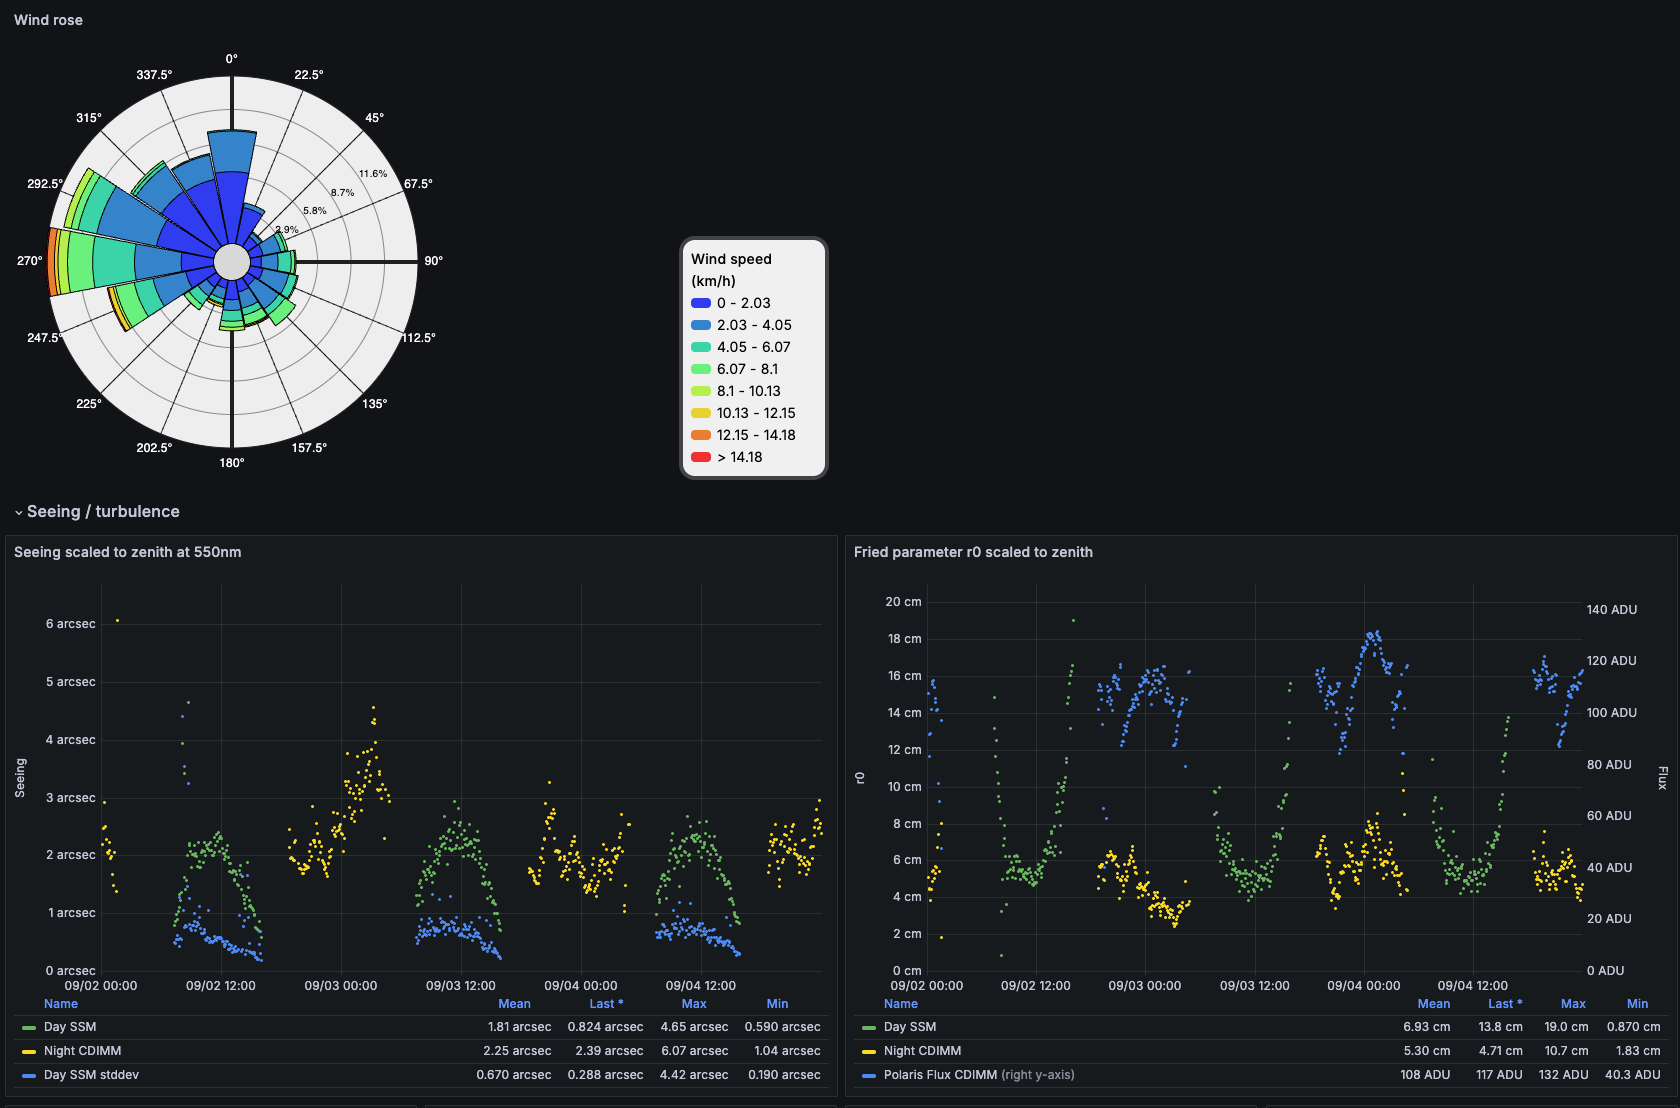
Every Sky Monitor comes with Grafana dashboards hosted by Miratlas and fed by the same data as DataHub. They turn the raw files into time series you read at a glance, over any period.

Open Grafana
Grafana · Instrument overview and weather data Enlarge
Fig. 03 · GrafanaInstrument overview and weather data
Grafana · Wind rose, seeing and Fried parameter Enlarge
Fig. 04 · GrafanaWind rose, seeing and Fried parameter
The Sky Monitor network

The Sky Monitor network

Maps the atmosphere from the ground, everywhere, all the time. Our database maps and models atmospheric turbulence, providing central data for optimising terrestrial and space telecommunications and dedicated offerings in a wide range of fields, with a historical view and short-term forecasting.

Unveil the sky.

Configure your Sky Monitor online and get pricing in real time, we get in touch to discuss next steps.

Pricing configurator skymonitor.demo